Data-Driven City Improves Performance
December 02, 2021 by Meredith Trimble

Stockton, California, emerged from bankruptcy in 2015 to become one of the most fiscally solvent large cities in the United States. The story of grit and recovery is an inspiring one, proving the power of local leaders and constituents to rebuild together. Even so, the stagnant period of economic growth also slowed progress on functions such as efficient city services and effective public communication.
City Manager Harry Black understood the city’s full renewal depended on rallying city staff around clear objectives, goals, strategies, and plans that are informed and measured by data.
Data-Empowered Workforce
To this end, Black created an Office of Performance & Data Analytics (OPDA). The new office’s director, Katie Regan, established and implemented a comprehensive performance management program for the city, including a performance scorecard, methods for cross-departmental performance management, streamlined municipal processes, and open sharing of performance data with the public.
“Our mission at OPDA is to enable the city of Stockton to deliver better, faster, and smarter services,” said Regan. “My office is here to facilitate and support our departments and service providers to help them shine and do their work to the best of their abilities.”
As the name of the office suggests, data analytics is central to the success of its mission.
One of the first things Regan did was work with each of the city’s department directors to appoint data coordinators. “Right off the bat we tried to find the champion who loves data and also uses the data within the department,” she said. In June 2021, Regan and her department-level champions launched Stockton’s first open data portal.
Performance Improvement and Equitable Service
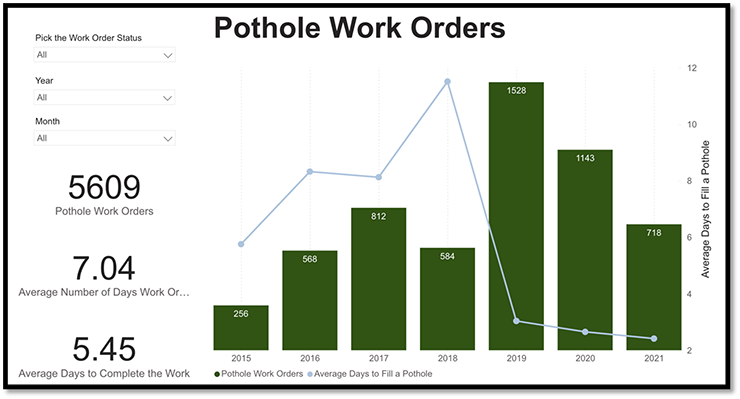
Stockton’s use of data is still growing, but city departments are already excited by what data has highlighted around important community issues. In the public works space, for example, data shows the city has dramatically improved the time it takes to fix potholes. By digging into the data, staff can look geographically across the city to see exactly where most service requests originate.
“There might be an assumption that all residents are telling us they want us to fill potholes,” explained Regan. But looking at the data by location and what is known about variations in access, there might be holes in those assumptions. “We need to consider that some people might not have the devices or the internet connection that would let them submit these service requests. The next question is: What other data could be used to close this gap? Perhaps service requests for potholes can be balanced with a pavement condition index, which indicates the general condition of a pavement section.”
According to Regan, this is an example of looking at performance beyond the obvious time-to-fill statistics. “We still need to provide services to residents based on their requests, but we also need to be proactive and equitable, which is where data can have a real impact.”
In the area of policing, the city meets quarterly with a community board drawn from representatives across faith-based groups, youth advocates, and other interested parties. The board adds a human layer to the conversations around data as they look at statistics on arrests, traffic stops, use of force, and critical incidents. These community conversations highlighted for the police department the need to improve and expand their internal early warning system’s data points – another example where data can help the city respond proactively.
Just the Beginning
Regan has found “reducing a conversation to data will never be enough, but it does create a reality check for the starting point of the conversation.” Other jurisdictions, regardless of size, can build on this example, working from issues and metrics reflecting their own community needs and strategic priorities.