Ramsey County Simplifies Assessor Report
April 14, 2020 by Melissa Crowe
Assessor reports are rife with quality data and information, but their dense PDF format is not known for being user-friendly.
If an average resident wanted to know the estimated market values for the year and how that relates to their taxes, the assessor’s reports are the first preview of what to expect. However, for many members of the public, navigating and understanding these reports is a challenge. In some jurisdictions, residents need to call the county, file a request, wait in a queue of other requests, wait for the data to be pulled, and then wait for a response. What if there was a better way?
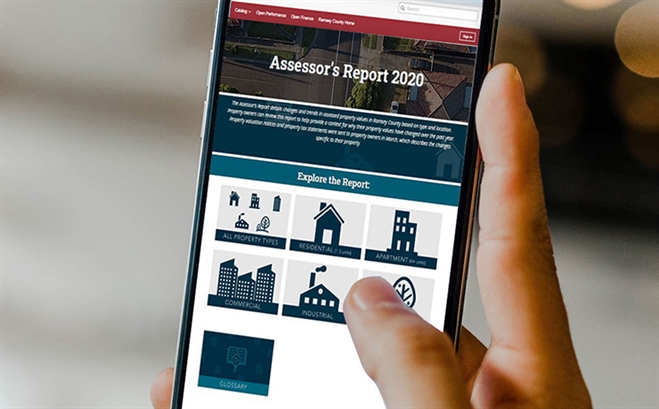
Ramsey County, Minnesota, Assessor Luis Rosario unveiled a new approach to share his annual assessor report via the county’s open data site. Rosario’s dashboard presents the same information from his report in a way that’s usable and makes sense for everyone.
“Picture the scenario where an appraiser is visiting with a property owner with questions about changes in their home’s value. With our report in our open data portal, we can pull up their neighborhood data on a map to review median values, compare trends, and explain more of our process in real time. We can provide faster service this way which is highly efficient for us, too.” - Ramsey County Assessor Luis Rosario
Years in the Making
Ramsey County Open Data Coordinator Kristine Grill started working on the project in 2017. On her first day in the role, a copy of the report was waiting for her on her desk. Grill says there was enthusiasm from folks all over the county to open up the report and “make it more accessible and interesting” to average residents. But technical barriers stood in the way.
“It was complex and required a high-level of data analysis and automation,” Grill says. “We did not have capacity for it then, but we have wonderful friends at Socrata who were willing to pitch in and help.”
The county built the dashboard using Socrata Perspectives, a data storytelling app that helps staff add context and narrative around complex data. The county also uses Perspectives for a host of other topics, including voter turnout, homelessness response, and even the county’s deer population.
“We’ve learned so much about Perspectives and doing things in Socrata over the years,” Grill said. “SCGC (Socrata Connected Government Cloud) had several of the tools that finally made this possible from a data perspective. Yes, our capacity was a challenge, but even from a technology standpoint, we needed SCGC to pull these data sources together — iasWorld and Oracle, parcel data, and valuation extract data."
“One of the benefits to this project was getting everyone in a room together and agree on a single process for presenting the data. Now people can compare commercial and residential in a more apples-to-apples way.” — Ramsey County Open Data Coordinator Kristine Grill
Visualize Your Data
Folks accessing this data come from a variety of backgrounds. There are users who work in local government, in areas like community or economic development, and residents who need more context into assessments and changes over time.
One aspect of the dashboard Grill says is a benefit to users is that it’s interactive. Because of that, it’s easy to use and more convenient than digging for data in a PDF.
“You have the opportunity to learn more,” she says. “It’s accessible to people at a variety of data literacy levels. If you’re super wonky, you have all the datasets available and can do your own analysis. If you’re interested but not as data-inclined, you can use the story as a tool and walk through what’s happening and play around with the charts. If this is brand new and you’re not comfortable with data, the narrative does a good job of walking you through the content step-by-step.”
Another benefit is that the dashboard brought together both sides of the assessor’s house: commercial and residential.
“As we were talking about processes, those two sides were doing things slightly differently,” Grill says. “One of the benefits to this project was getting everyone in a room together and agree on a single process for presenting the data. Now people can compare commercial and residential in a more apples-to-apples way.”

Photo credit: Tony Webster/Flickr
The Data Takeaway
Throughout the process, Grill offers this perspective to other government data leaders: assume nothing.
“Too often it’s easy to assume that people know what we do,” she says. “Perspectives provides a good way to explain what it is we’re doing and how we’re doing it. In that same vein, people are coming at us from a variety of technical skills. If you’re only presenting from the data perspective, you’re missing a huge part of your audience.”
The practice in Ramsey County is that any dataset available on the open data portal must include a story made in Perspectives.
“You have to talk about your data and think about it in a more holistic way,” Grill says. “Having a conversation with a communications staff member or myself about what we’re looking at tends to improve the product.”
As a result, the public can gain clear explanations and context to what’s going on in the county, and employees can cut down the number of times they answer the same question.
The ROI of Data Use
For some open data projects in the county, spending four hours to develop a dashboard — such as on the county’s uncashed checks — can add up to save employees hours each month.
Others, such as the assessor dashboard, will add up to thousands of dollars in time savings, Grill says.
“People generally don’t have a good concept of how much time they spend doing any one thing,” Grill says.
Setting up the assessor’s report took hundreds of hours, but now that the data has been identified and the framework built, the assessor’s office will be able to see big time savings in 2021.
The assessor is already looking forward to staff having answers at their fingertips.
“I’ll be working with my appraisers to become very comfortable using this tool on their tablets,” Rosario says. “Picture the scenario where an appraiser is visiting with a property owner with questions about changes in their home’s value. With our report in our open data portal, we can pull up their neighborhood data on a map to review median values, compare trends, and explain more of our process in real time. We can provide faster service this way which is highly efficient for us, too.”